
When people ask about Bus Accident Statistics in the United States, the answer reveals encouraging and troubling trends. While buses remain one of the safest ways to travel, their sheer size means that when collisions occur, they often cause devastating harm to other motorists, pedestrians, and passengers.
Contact a Bus Accident Lawyer
At Paulson Coletti, we’ve seen how these statistics affect Portland families, reminding us that every number reflects real people facing life-changing consequences.
In the United States, buses are relied upon to transport large groups of people and carry our children to and from school. Annually, as many as 700 million people travel by bus. Passengers, other motorists, and their families have a reasonable expectation that they will safely arrive at their destinations.
Unfortunately, this isn’t always the case.
While collisions involving buses make up only a small portion of the total fatal accidents each year, the results are usually tragic. In fact, the NTSB has found that, per vehicle, buses and other commercial motor vehicles are more likely to be involved in fatal crashes than passenger vehicles.
- In 2018, a drunk school bus driver collided with a dump truck, killing a 10-year-old student and a teacher in Carrollton, Texas.
- On February 22, 2020 a charter bus carrying 21 people overturned in San Diego, CA, leaving three dead and another eighteen injured.
Even when passengers are kept safe, poor sightlines from the vehicle and negligent bus drivers can put pedestrians, cyclists, and passenger vehicle occupants at risk. In fact, historically, only 13 percent of those killed in bus accidents are occupants.
When, where, and how often do buses crash?
At Paulson Coletti, our Portland Bus Accident Lawyer represented families who have lost loved ones in bus collisions, and we have seen the devastation that a deadly bus accident can bring. As a service to those affected by or interested in bus safety, we’ve compiled the most comprehensive list of bus accident statistics and information available online.
How Often Do Buses Crash?
Buses are involved in more than 65,000 crashes nationwide each year. These incidents range from minor fender benders to catastrophic accidents that involve multiple vehicles. The Federal Motor Carrier Safety Administration (FMCSA) tracks these events, showing that collisions are most common in densely populated areas where transit and school buses share the road with heavy traffic.
In Oregon, accidents often involve TriMet buses navigating Portland’s busiest intersections or school buses traveling through neighborhoods. These numbers show that while bus travel is generally safe, large vehicles require extra caution and awareness from drivers sharing the road.
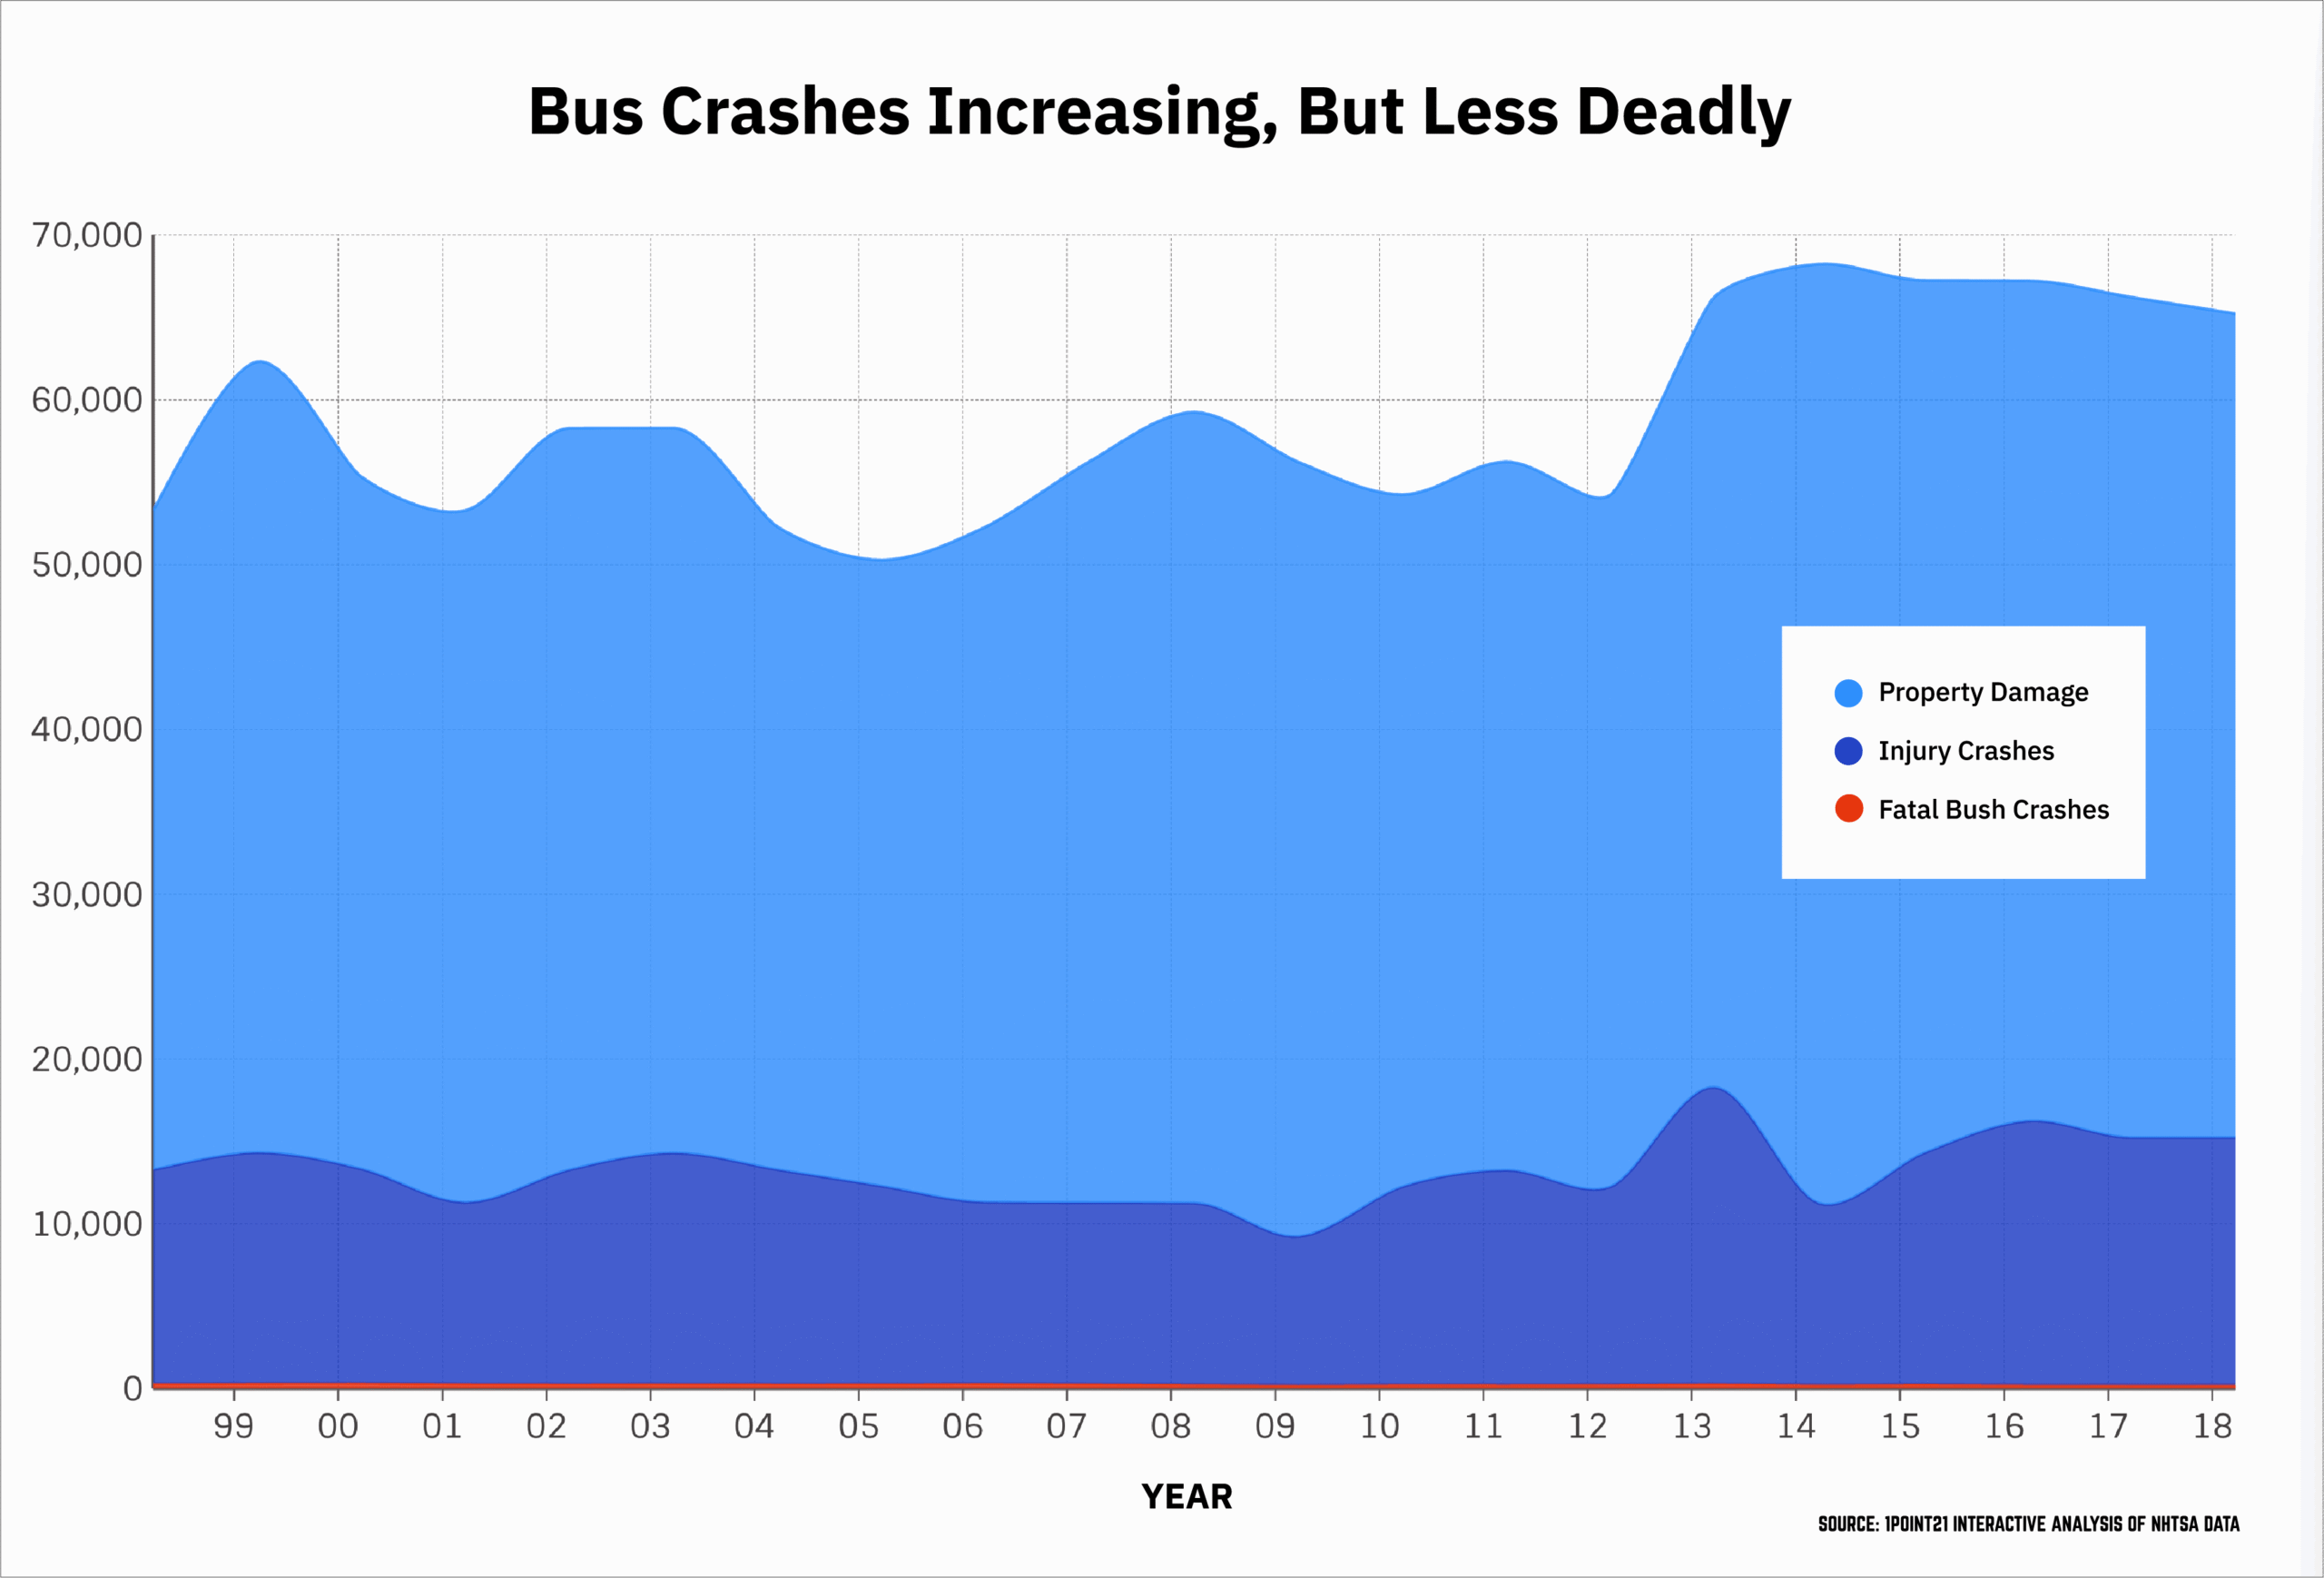
From 2000 to 2018, fatal bus crashes have declined by 29 percent, while injury crashes have risen by 15 percent. In 2000, there were 323 fatal bus crashes, compared to 230 fatal bus crashes in 2018. However, in the case of injury crashes, the numbers rose from 13,000 in 2000 to 15,000 in 2018. Bus safety is regulated at the state and federal levels, and school buses are known to be some of the most regulated vehicles on the road. That may contribute to the decline in fatal bus crashes.
| Year | Fatal Bus Crashes | Injury Crashes | Property Damage Only |
|---|---|---|---|
| 1998 | 288 | 13,000 | 40,000 |
| 1999 | 313 | 14,000 | 48,000 |
| 2000 | 323 | 13,000 | 42,000 |
| 2001 | 289 | 11,000 | 42,000 |
| 2002 | 274 | 13,000 | 45,000 |
| 2003 | 288 | 14,000 | 44,000 |
| 2004 | 276 | 13,000 | 39,000 |
| 2005 | 278 | 12,000 | 38,000 |
| 2006 | 303 | 11,000 | 41,000 |
| 2007 | 280 | 11,000 | 45,000 |
| 2008 | 251 | 11,000 | 48,000 |
| 2009 | 221 | 9,000 | 47,000 |
| 2010 | 247 | 12,000 | 42,000 |
| 2011 | 243 | 13,000 | 43,000 |
| 2012 | 252 | 12,000 | 42,000 |
| 2013 | 282 | 18,000 | 48,000 |
| 2014 | 235 | 11,000 | 57,000 |
| 2015 | 259 | 14,000 | 53,000 |
| 2016 | 231 | 16,000 | 51,000 |
| 2017 | 231 | 15,000 | 51,000 |
| 2018 | 230 | 15,000 | 50,000 |
| 2019 | 231 | N/A | N/A |
“At Paulson Coletti, ‘liberty and justice for all’ is more than just a phrase – it is our mandate. Our team of trial lawyers is driven to pursue justice for the injured, ensuring that the responsible parties are held accountable. Whether your case settles or goes to trial, you can trust our Oregon personal injury lawyers to be the legal advocates you need so your voice can be heard.”

How many people are killed or injured by buses each year?
Each year, more than 250 lives are lost and about 15,000 people are injured in bus accidents in the U.S. Many fatalities occur among occupants of other vehicles, motorcyclists, or pedestrians rather than passengers inside the bus. This makes sense given the weight and size disparity between buses and cars.
Bus crash victims often face long recoveries, high medical bills, and lasting trauma. To better understand who is most at risk, consider these groups:
- School children, especially while boarding or exiting buses.
- Commuters who rely on city buses in crowded urban centers.
- Pedestrians and bicyclists who share intersections with transit routes.
- Other motorists who are struck during highway collisions.
These patterns confirm why Bus Accident Statistics in the United States matter deeply to public safety and families navigating recovery after a crash.
| Year | Fatalities | Injuries |
|---|---|---|
| 1998 | 329 | 30,000 |
| 1999 | 373 | 36,000 |
| 2000 | 357 | 29,000 |
| 2001 | 331 | 25,000 |
| 2002 | 331 | 30,000 |
| 2003 | 337 | 31,000 |
| 2004 | 315 | 29,000 |
| 2005 | 340 | 23,000 |
| 2006 | 337 | 21,000 |
| 2007 | 325 | 24,000 |
| 2008 | 311 | 24,000 |
| 2009 | 254 | 20,000 |
| 2010 | 278 | 27,000 |
| 2011 | 284 | 24,000 |
| 2012 | 282 | 23,000 |
| 2013 | 320 | 38,000 |
| 2014 | 283 | 22,000 |
| 2015 | 297 | 24,000 |
| 2016 | 290 | 35,000 |
| 2017 | 276 | 25,000 |
| 2018 | 262 | 27,000 |
| 2019 | 258 | N/A |
[Interactive Map] Fatal Bus Accidents in the U.S.
Fatal bus crashes happen in nearly every state, though frequency varies widely. Interactive mapping of federal data highlights clusters in major metropolitan regions such as New York, Los Angeles, Dallas, and Miami. Heavier transit reliance in these areas means more exposure to potential accidents.
For Portland residents, TriMet buses operate across dozens of routes daily. Oregon may not top national charts, but even one fatal bus crash can devastate a community. These maps reinforce the reality that statistics represent real people, passengers, children, and drivers whose lives are forever impacted.
“Most cases settle, but each of our cases is prepared as if it’s going to trial. The insurance companies know it and so do the defense lawyers defending them. That’s why we get such great results for our clients.”

Fatal Bus Crashes by State
California, Texas, and Florida consistently report the highest number of fatal bus crashes. This is mainly due to larger populations, urban sprawl, and heavier use of public and charter buses.
Oregon’s figures are lower, but each case carries weight. One Portland school bus or motorcoach crash can cause multiple injuries, wrongful death claims, and complex litigation.. By understanding Bus Accident Statistics in the United States at the state level, policymakers and lawyers can better advocate for improved safety and stronger protections for victims.
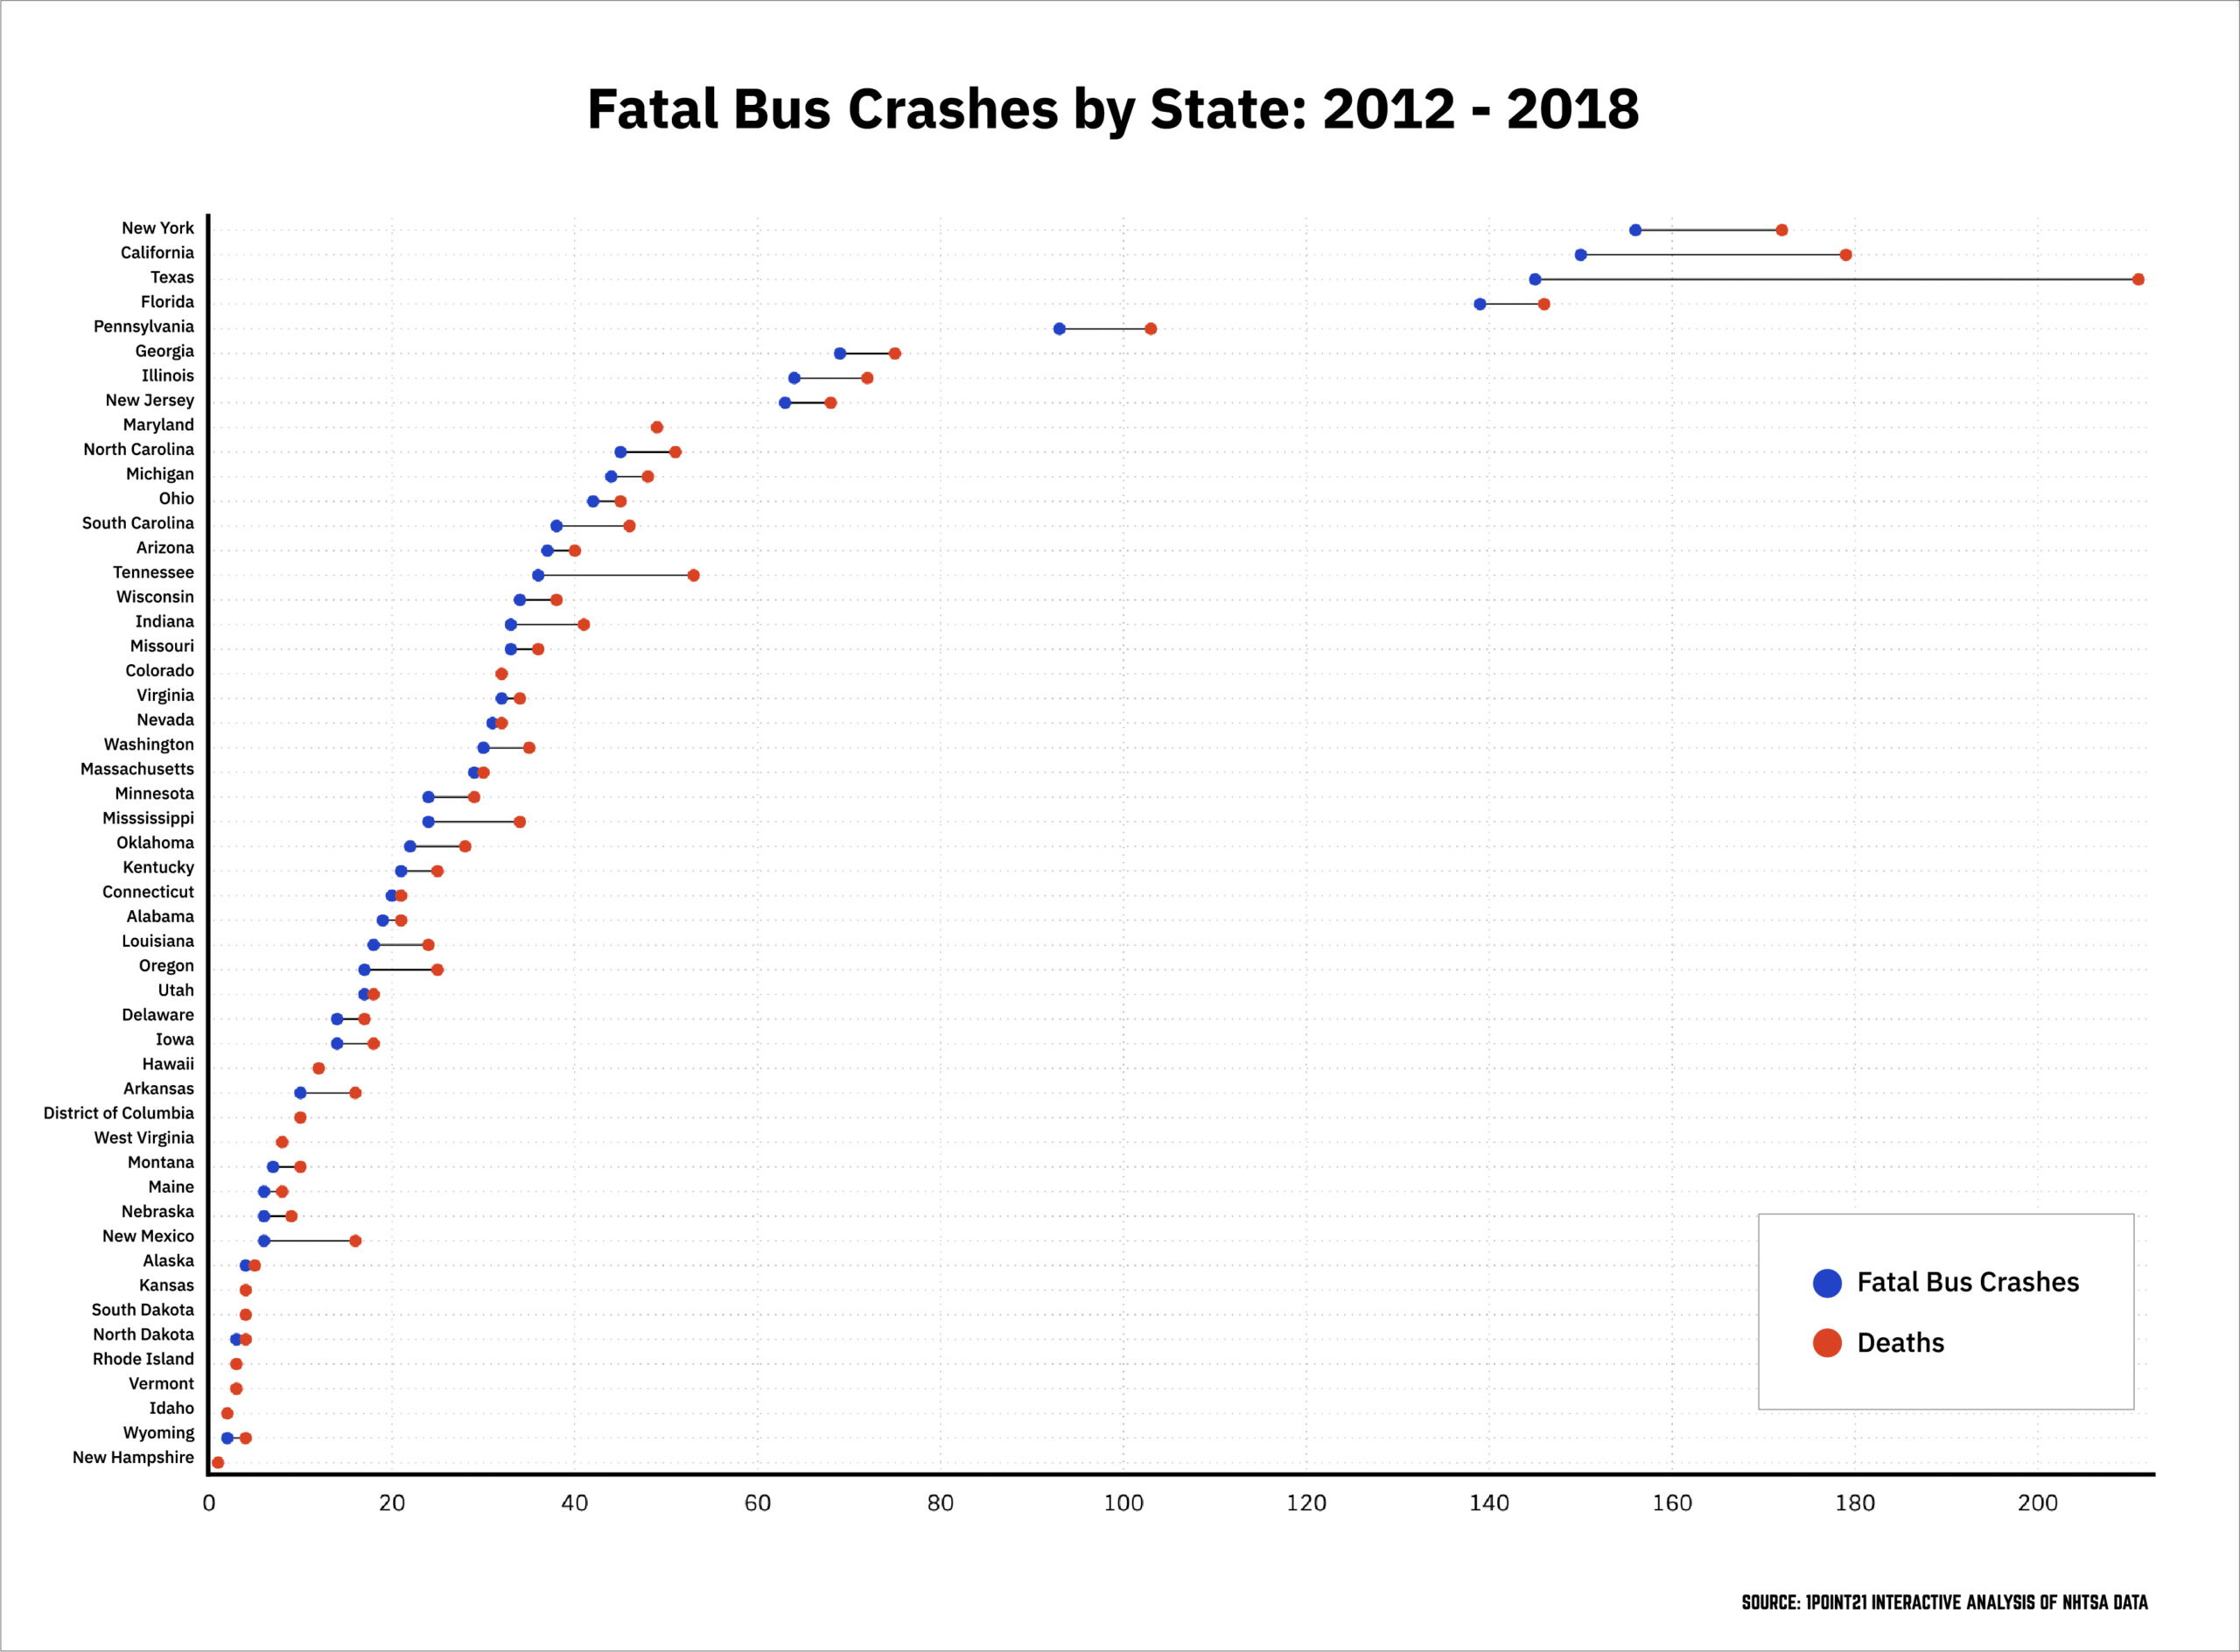
California (150), Texas (145), and Florida (139) follow New York with the most fatal bus crashes and also have some of the largest metropolitan areas in the U.S. In 2018, a truck driver lost control of his vehicle and crashed into a church bus in South Texas, killing the bus driver and 12 of the 13 passengers in the bus. The truck driver had been impaired by marijuana, combined with the misuse of prescription drugs used to treat seizures and panic disorders.
| State | Fatal Bus Crashes | Deaths |
|---|---|---|
| New York | 156 | 172 |
| California | 150 | 179 |
| Texas | 145 | 211 |
| Florida | 139 | 146 |
| Pennsylvania | 93 | 103 |
| Georgia | 69 | 75 |
| Illinois | 64 | 72 |
| New Jersey | 63 | 68 |
| Maryland | 49 | 49 |
| North Carolina | 45 | 51 |
| Michigan | 44 | 48 |
| Ohio | 42 | 45 |
| South Carolina | 38 | 46 |
| Arizona | 37 | 40 |
| Tennessee | 36 | 53 |
| Wisconsin | 34 | 38 |
| Indiana | 33 | 41 |
| Missouri | 33 | 36 |
| Colorado | 32 | 32 |
| Virginia | 32 | 34 |
| Nevada | 31 | 32 |
| Washington | 30 | 35 |
| Massachusetts | 29 | 30 |
| Minnesota | 24 | 29 |
| Mississippi | 24 | 34 |
| Oklahoma | 22 | 28 |
| Kentucky | 21 | 25 |
| Connecticut | 20 | 21 |
| Alabama | 19 | 21 |
| Louisiana | 18 | 24 |
| Oregon | 17 | 25 |
| Utah | 17 | 18 |
| Delaware | 14 | 17 |
| Iowa | 14 | 18 |
| Hawaii | 12 | 12 |
| Arkansas | 10 | 16 |
| District Of Columbia | 10 | 10 |
| West Virginia | 8 | 8 |
| Montana | 7 | 10 |
| Maine | 6 | 8 |
| Nebraska | 6 | 9 |
| New Mexico | 6 | 16 |
| Alaska | 4 | 5 |
| Kansas | 4 | 4 |
| South Dakota | 4 | 4 |
| North Dakota | 3 | 4 |
| Rhode Island | 3 | 3 |
| Vermont | 3 | 3 |
| Idaho | 2 | 2 |
| Wyoming | 2 | 4 |
| New Hampshire | 1 | 1 |
Which Bus Type is Involved in the Most Fatal Collisions?
School buses consistently cause the greatest number of fatal bus accidents nationwide. Though designed with reinforced safety features, their frequency of use, often carrying dozens of children daily, leads to higher exposure to risk.
Transit buses operating in city centers also account for a significant share of collisions. Data from FMCSA’s Cargo Body Type Report highlights that school buses rank highest in fatal crashes, followed closely by transit buses that navigate busy metro areas.
This distinction matters because the type of bus involved often shapes the nature of the injuries, the parties liable, and the damages sought in legal claims.
From 1975 through 2019, 4,702 school buses and 4,702 transit buses were involved in fatal crashes in the United States.
| Year | School Bus | Motorcoach | Transit Bus | Van-Based Bus | Other Bus Type | Bus Type Unknown |
|---|---|---|---|---|---|---|
| 1975 | 130 | 29 | 131 | — | 18 | 19 |
| 1976 | 123 | 30 | 130 | — | 13 | 23 |
| 1977 | 126 | 33 | 123 | — | 14 | 25 |
| 1978 | 143 | 54 | 143 | — | 14 | 18 |
| 1979 | 150 | 37 | 123 | — | 21 | 16 |
| 1980 | 117 | 38 | 150 | — | 14 | 11 |
| 1981 | 110 | 48 | 150 | — | 20 | 14 |
| 1982 | 104 | 37 | 106 | — | 31 | 11 |
| 1983 | 99 | 41 | 105 | — | 40 | 22 |
| 1984 | 119 | 48 | 103 | — | 33 | 17 |
| 1985 | 126 | 29 | 116 | — | 33 | 33 |
| 1986 | 101 | 33 | 99 | — | 29 | 24 |
| 1987 | 132 | 29 | 115 | — | 46 | 31 |
| 1988 | 105 | 31 | 103 | — | 30 | 18 |
| 1989 | 109 | 32 | 120 | — | 25 | 25 |
| 1990 | 112 | 27 | 114 | — | 19 | 17 |
| 1991 | 106 | 39 | 86 | — | 26 | 17 |
| 1992 | 98 | 36 | 113 | — | 21 | 17 |
| 1993 | 112 | 28 | 82 | — | 21 | 20 |
| 1994 | 106 | 23 | 105 | — | 12 | 12 |
| 1995 | 109 | 23 | 101 | — | 23 | 15 |
| 1996 | 124 | 35 | 115 | — | 32 | 20 |
| 1997 | 117 | 37 | 109 | — | 15 | 19 |
| 1998 | 112 | 38 | 115 | — | 16 | 8 |
| 1999 | 139 | 38 | 106 | — | 19 | 17 |
| 2000 | 120 | 40 | 128 | — | 20 | 17 |
| 2001 | 119 | 38 | 104 | — | 16 | 15 |
| 2002 | 95 | 35 | 100 | — | 26 | 18 |
| 2003 | 113 | 26 | 104 | — | 30 | 18 |
| 2004 | 111 | 35 | 85 | — | 26 | 22 |
| 2005 | 111 | 38 | 83 | — | 34 | 14 |
| 2006 | 118 | 33 | 105 | — | 22 | 27 |
| 2007 | 109 | 35 | 113 | — | 16 | 8 |
| 2008 | 116 | 20 | 92 | — | 12 | 11 |
| 2009 | 89 | 38 | 77 | — | 9 | 8 |
| 2010 | 116 | 36 | 84 | — | 11 | 4 |
| 2011 | 98 | 41 | 68 | 25 | 10 | 3 |
| 2012 | 102 | 34 | 78 | 30 | 7 | 2 |
| 2013 | 114 | 44 | 82 | 28 | 10 | 4 |
| 2014 | 91 | 32 | 79 | 9 | 21 | 4 |
| 2015 | 99 | 34 | 93 | 14 | 18 | 5 |
| 2016 | 88 | 17 | 98 | 6 | 19 | 6 |
| 2017 | 73 | 13 | 97 | 31 | 16 | 4 |
| 2018 | 85 | 15 | 85 | 26 | 20 | 3 |
| 2019 | 89 | 5 | 84 | – | 46 | 8 |
Causes and General Bus Safety Tips
The leading causes of bus accidents include driver fatigue, distraction, mechanical issues, and unsafe road conditions. Weather plays a role as well; rain and ice in Oregon can increase risks for both school and public transit buses. Practical steps can help reduce accidents and injuries:
- Give buses extra space for wide turns.
- Never pass a school bus when its stop arm is extended.
- Be alert near bus stops and crosswalks.
- Teach children to wait until the driver signals safety before crossing the street.
These safety steps, better roads, and enforcement could significantly reduce serious bus crashes in Portland and nationwide.
Contact Our Portland Bus Accident Lawyers Today
At Paulson Coletti, we know that Bus Accident Statistics in the United States represent real families facing medical bills, lost income, and lasting trauma. Our Portland trial lawyers have stood up to bus companies and insurers across Oregon, fighting for justice and full compensation.
Call us today at 503-226-6361 to speak with a Portland bus accident lawyer at Paulson Coletti. We’ll hold negligent parties accountable and protect your future.